In the world of web development, visual representations of data are crucial for creating engaging user experiences. One of the simplest yet most effective ways to display data visually is through a horizontal bar chart. This guide will walk you through the process of creating a basic HTML horizontal bar chart from scratch.
Step1: HTML Chart Structure
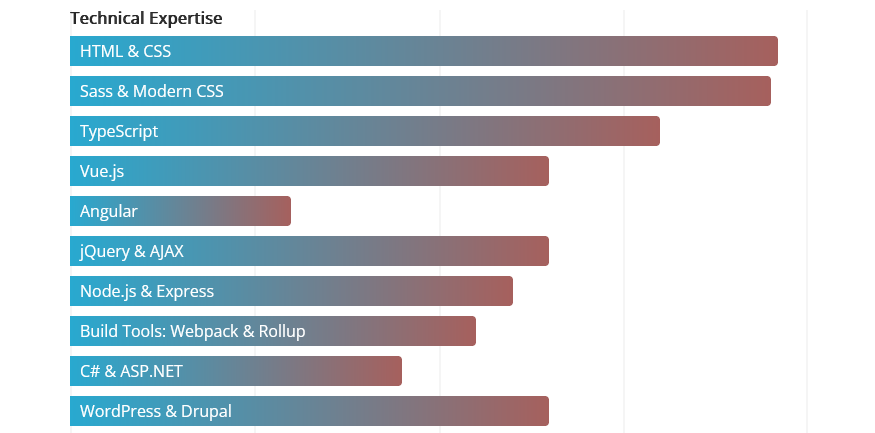
The HTML code defines a structured layout to showcase a professional’s skill set across three categories: Technical Expertise, Operational Efficiency, and Creative Skills. It uses a combination of lists and div elements to represent different proficiency levels and specific skills within these categories, with visual bars indicating the level of expertise in each area.
<div class="skills">
<ul class="lines">
<li class="line l--0">
<span class="line__label title">
Proficiency Level:
</span>
</li>
<li class="line l--25">
<span class="line__label">
Beginner
</span>
</li>
<li class="line l--50">
<span class="line__label">
Intermediate
</span>
</li>
<li class="line l--75">
<span class="line__label">
Advanced
</span>
</li>
<li class="line l--100">
<span class="line__label">
Specialist
</span>
</li>
</ul>

<div class="charts">
<div class="chart chart--dev">
<span class="chart__title">Technical Expertise</span>
<ul class="chart--horiz">
<li class="chart__bar" style="width: 96%;">
<span class="chart__label">
HTML & CSS
</span>
</li>
<li class="chart__bar" style="width: 95%;">
<span class="chart__label">
Sass & Modern CSS
</span>
</li>
<li class="chart__bar" style="width: 80%;">
<span class="chart__label">
TypeScript
</span>
</li>
<li class="chart__bar" style="width: 65%;">
<span class="chart__label">
Vue.js
</span>
</li>
<li class="chart__bar" style="width: 30%;">
<span class="chart__label">
Angular
</span>
</li>
<li class="chart__bar" style="width: 65%;">
<span class="chart__label">
jQuery & AJAX
</span>
</li>
<li class="chart__bar" style="width: 60%;">
<span class="chart__label">
Node.js & Express
</span>
</li>
<li class="chart__bar" style="width: 55%;">
<span class="chart__label">
Build Tools: Webpack & Rollup
</span>
</li>
<li class="chart__bar" style="width: 45%;">
<span class="chart__label">
C# & ASP.NET
</span>
</li>
<li class="chart__bar" style="width: 65%;">
<span class="chart__label">
WordPress & Drupal
</span>
</li>
</ul>
</div>
<div class="chart chart--prod">
<span class="chart__title">Operational Efficiency</span>
<ul class="chart--horiz">
<li class="chart__bar" style="width: 80%;">
<span class="chart__label">
Version Control: Git & SVN
</span>
</li>
<li class="chart__bar" style="width: 85%;">
<span class="chart__label">
Office Suite & Collaboration
</span>
</li>
</ul>
</div>
<div class="chart chart--design">
<span class="chart__title">Creative Skills</span>
<ul class="chart--horiz">
<li class="chart__bar" style="width: 50%;">
<span class="chart__label">
Figma & Adobe XD
</span>
</li>
<li class="chart__bar" style="width: 45%;">
<span class="chart__label">
Adobe Photoshop
</span>
</li>
<li class="chart__bar" style="width: 40%;">
<span class="chart__label">
Adobe Illustrator
</span>
</li>
<li class="chart__bar" style="width: 85%;">
<span class="chart__label">
UX/UI Design Principles
</span>
</li>
</ul>
</div>
</div>
</div>
Step2: CSS Styles for Animated Skill Chart
This CSS code snippet styles a skill visualization chart, using animations and gradients to dynamically showcase proficiency levels across different skill categories on a webpage. It includes custom animations for the chart titles and bars.
@import url(https://fonts.googleapis.com/css?family=Open+Sans);
body {
margin: 20px 0 40px;
font-family: "Open Sans", sans-serif;
color: #282828;
}
.skills {
width: 80%;
max-width: 960px;
height: 780px;
height: 788px;
margin: auto;
position: relative;
}
.lines {
height: 100%;
position: relative;
}
.line {
height: inherit;
width: 2px;
position: absolute;
background: rgba(238, 238, 238, 0.6);
}
.line.l--0 {
left: 0;
}
.line.l--25 {
left: 25%;
}
.line.l--50 {
left: 50%;
}
.line.l--75 {
left: 75%;
}
.line.l--100 {
left: calc(100% - 1px);
}
.line__label {
display: block;
width: 100px;
text-align: center;
position: absolute;
bottom: -20px;
right: -50px;
}
.line__label.title {
text-transform: uppercase;
font-weight: bold;
}
.charts {
width: 100%;
height: 100%;
position: absolute;
top: 0;
left: 0;
z-index: 10;
}
.chart:not(:first-child) {
margin-top: 10px;
}
.chart__title {
display: block;
margin: 0 0 10px;
font-weight: bold;
opacity: 0;
animation: 1s anim-lightspeed-in ease forwards;
}
.chart--prod .chart__title {
animation-delay: 3.3s;
}
.chart--design .chart__title {
animation-delay: 4.5s;
}
.chart--horiz {
overflow: hidden;
}
.chart__bar {
height: 30px;
margin-bottom: 10px;
background: linear-gradient(to left, #a6605d, #28a9d0);
border-top-right-radius: 4px;
border-bottom-right-radius: 4px;
opacity: 0;
animation: 1s anim-lightspeed-in ease forwards;
}
.chart--dev .chart__bar:nth-of-type(11) {
animation-delay: 2.7s;
}
.chart--dev .chart__bar:nth-of-type(10) {
animation-delay: 2.5s;
}
.chart--dev .chart__bar:nth-of-type(9) {
animation-delay: 2.3s;
}
.chart--dev .chart__bar:nth-of-type(8) {
animation-delay: 2.1s;
}
.chart--dev .chart__bar:nth-of-type(7) {
animation-delay: 1.9s;
}
.chart--dev .chart__bar:nth-of-type(6) {
animation-delay: 1.7s;
}
.chart--dev .chart__bar:nth-of-type(5) {
animation-delay: 1.5s;
}
.chart--dev .chart__bar:nth-of-type(4) {
animation-delay: 1.3s;
}
.chart--dev .chart__bar:nth-of-type(3) {
animation-delay: 1.1s;
}
.chart--dev .chart__bar:nth-of-type(2) {
animation-delay: 0.9s;
}
.chart--dev .chart__bar:nth-of-type(1) {
animation-delay: 0.7s;
}
.chart--prod .chart__bar:nth-of-type(2) {
animation-delay: 4.2s;
}
.chart--prod .chart__bar:nth-of-type(1) {
animation-delay: 4s;
}
.chart--design .chart__bar:nth-of-type(4) {
animation-delay: 5.8s;
}
.chart--design .chart__bar:nth-of-type(3) {
animation-delay: 5.6s;
}
.chart--design .chart__bar:nth-of-type(2) {
animation-delay: 5.4s;
}
.chart--design .chart__bar:nth-of-type(1) {
animation-delay: 5.2s;
}
.chart__label {
padding-left: 10px;
line-height: 30px;
color: white;
}
@keyframes anim-lightspeed-in {
0% {
transform: translateX(-200%);
opacity: 1;
}
100% {
transform: translateX(0);
opacity: 1;
}
}
Source Code To Create HTML Horizontal Bar Chart Demo
Creating a horizontal bar chart with HTML and CSS is a straightforward process that can significantly enhance the presentation of data on your website. By following these steps, you can develop a basic understanding of how to implement visual data representation in web development.